Banner Ad

Sunday, March 13, 2016

Identify the ASP.Net Version of an ASP.Net Application from Browser

By Francis   Posted at   2:12 PM   Web Development No comments
                    

                        In my previous article, i explained about how to use IE Developer tool bar. As a web developer, whenever I browse a “cool” website, i always want to know about what type of technology behind this. As an ASP.Net developer, in this post, i’m going to discuss about how to identify a particular website is built with ASP.Net or Not from the popular browsers like IE, Chrome and Firefox. There are various ways exist, I’m here listed few of them.
Analyze the Source Code:
                       If a website is built with ASP.Net Webforms you can identify it by review the “markup” source code from the browser. If the website built with web form then you can find the hidden element called “viewstate” in the source code. This will hint that the page you are viewing is developed using ASP.Net Web Form. 
                     This is the easiest way to find whether the website you are viewing built with ASP.Net web form or not. But this technique, will not tell the version of the ASP.Net. If you want, to know about the version information also then you need to follow any one of the below ways.

Use third party plugins:
                    Yes! There are third party browser plugin also available for this purpose. You can find the one in the below url: http://builtwith.com/toolbar
                    This plugin is available for most of the popular browsers like Firefox, Chrome and Safari except IE, when i write this post. Just include this on your browsers and you can find out the technology behind with the currently rendered on the browser.
Using Built with Addon
Using Developer Toolbar:
                         IE doesn’t require any plugins or add-ons. You can find the technology behind this using the built-in tool called “IE Developer Toolbar”. This toolbar, contains a tab called “Network”. In this tab, you can find the necessary detail.

Read : How to use IE Developer Toolbar.


Using Fiddler:
                     As all of us know that Fiddler is a famous Web Debugger, which is also provide the facility to analyse the response header elements as the previous one. If you don’t have Fiddler you can download it from this url: https://www.telerik.com/download/fiddler


Readers, hope you enjoy this post. Let me know your thoughts as comments!

Thursday, March 10, 2016

F12 Developer Toolbar in IE– A Good Rescuer

By Francis   Posted at   8:25 PM   IE Developer Toolbar No comments


                             As a web developer, every one will dealt with Internet Explorer. Since our ultimate final output will be render the proper “angle brackets” in browser. In some cases, we may find difficult to debug the rendered HTML. At that time, F12 developer toolbar comes as a rescuer. In this tutorial i have used Internet Explorer Version 10. If you are using the next versions of IE, the look and feel of the toolbar vary slightly, but there is no functional changes that are discussed here. :)

So what is F12 Developer Toolbar:
                           F12 Developer Toolbar is a built-in add-on with Internet Explorer. It will popup from IE when you press F12 Key on your keyboard. Alternatively you can get it by clicking “Tools –> F12 developer tools”. By default, it will be stick with the bottom of IE. In the following section I have mentioned the the uses of F12 Developer toolbar.

F12 Developer Toolbar
Using F12 Developer Toolbar:
There are lot of uses of F12 Developer Toolbar. In this article I am going to highlight few of them. With F12 Toolbar you can:
1) Select DOM Elements
2) Debug Javascript
3) Identify the Javascript errors or missing HTML tag errors on your files.
4) Trace the applied CSS classes.
5) Analyze the Network Timing

Set up the code:
In order to explain the above functionalities I have used the below HTML markup. It’s a simple ASPX file with a textbox and a button. The text box accepts an integer value and validate it and show the alert box accordingly.
<%@ Page Language="C#" AutoEventWireup="true" CodeBehind="Home.aspx.cs" Inherits="SessionDemo.Home" %>
<!DOCTYPE html>
<html xmlns="http://www.w3.org/1999/xhtml">
<head runat="server">
    <title></title>
    <link href="Home.css" rel="stylesheet" />
    <script type="text/javascript">
        function validateAge()
        {
            var age = document.getElementById("txtAge").value;
            if(isNaN(age))
            {
                alert("You have entered valid age");
            }
            else {
                alert("You have entered invalid age");
            }
        }
    </script>
</head>
<body>
    <form id="form1" runat="server">
        <div>
            Enter Age: 
            <input type="text" id="txtAge" />
            <input type="button" id="btnValidate" value="Validate Age" onclick="validateAge();" class="btn"/>
        </div>
    </form>
</body>
</html>

Select DOM Elements:
This is an important feature of Developer Toolbar. You can easily navigate the particular DOM elements by clicking on it on the IE. So that you can easily spot the respective "piece of markup" for that element in the whole page. This facilitate to easily fix the issues related to design.In order to select the DOM element, you need to do the following:
  1. Select the Arrow mark icon (Select Element by click) on the top left in Developer toolbar.
  2. Now you can select any element in the page(Elements are highlighted with the rectangle boxes).
  3. When you select the element, soon the IE Developer toolbar will highlight the particular markup. Refer the below screen shot.

Select DOM Element
Debug JS using F12 Toolbar:
In order to debug the JS, just run the above HTML page in IE and follow the steps:
1) Open F12 Toolbar
2) Go to “Script” tab, where the entire markup listed.
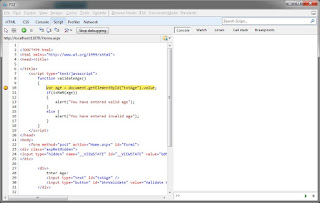
3) Place the breakpoint on the javascript. (Please refer the below screen how to set the breakpoint)
4) Click on the “Start debugging” button.
5) Since the Js function is triggered when you click the button. Just click the button to start the debugging.
Setup the Breakpoint
Debug JS in IE Developer Toolbar

Identify the Javascript errors:
                  In some case as a developer we may do some mistakes typo error. As an example, refer the below code at line no 10, wrongly typed as value() instead of value (which is get the text box value). There is no such method is available in JS. It will be easily identified by IE developer toolbar. The point here is, these type of Javascript related issues easily identified by IE Developer tool bar.

<%@ Page Language="C#" AutoEventWireup="true" CodeBehind="Home.aspx.cs" Inherits="SessionDemo.Home" %>
<!DOCTYPE html>
<html xmlns="http://www.w3.org/1999/xhtml">
<head runat="server">
    <title></title>
    <link href="Home.css" rel="stylesheet" />
    <script type="text/javascript">
        function validateAge()
        {
            var age = document.getElementById("txtAge").value();
            if(isNaN(age))
            {
                alert("You have entered valid age");
            }
            else {
                alert("You have entered invalid age");
            }
        }
    </script>
</head>
<body>
    <form id="form1" runat="server">
        <div>
            Enter Age: 
            <input type="text" id="txtAge" />
            <input type="button" id="btnValidate" value="Validate Age" onclick="validateAge();" class="btn"/>
        </div>
    </form>
</body>
</html>

In order to identify these kind of issues, you should follow the below steps:
1) Render you page in IE.
2) Open F12 toolbar.
3) Select the “Console” tab.
4) Since this JS function is called when you hit the button “Validate Age”. So just click on it.
5) You can see the error messge and when you click on the hyper link detail it will point out the repective line that causes the error.
Identify Javascript Error

Identify missing HTML tag errors:
                                Most of the time we may not closed the end tag of the HTML element. Most of the time it will not cause any issues luckily. In some worst cases, it will collapse all the design of your page. IE Developer tool bar is very much helpful in this case also. It will throw a warning message in the “Console” if your markup missed out anything like missing closing tag.

<%@ Page Language="C#" AutoEventWireup="true" CodeBehind="Home.aspx.cs" Inherits="SessionDemo.Home" %>
<!DOCTYPE html>
<html xmlns="http://www.w3.org/1999/xhtml">
<head runat="server">
    <title></title>
    <link href="Home.css" rel="stylesheet" />
    <script type="text/javascript">
        function validateAge()
        {
            var age = document.getElementById("txtAge").value();
            if(isNaN(age))
            {
                alert("You have entered valid age");
            }
            else {
                alert("You have entered invalid age");
            }
        }
    </script>
</head>
<body>
    <form id="form1" runat="server">
        <div>
            Enter Age: 
            <input type="text" id="txtAge" />
            <span><span>
            <input type="button" id="btnValidate" value="Validate Age" onclick="validateAge();" class="btn"/>
        </div>
    </form>
</body>
</html>

As you see the above code missing a closing tag in the “span” element at the line no 26. When you run the page you can see the warning message in the console like below:
Identify Missing HTML Tags using Developer Toolbar

Trace CSS:
                  In some cases, we may require the to change the applied css, in the page to achieve the exact design as per requirement we have. Normally, as a developer we render the page in browser and comes to the source code and adjust the CSS classes then again go to and run the page in browser to check the changes.
                 In these kind of scenario, F12 developer tool bar plays a vital role to save developer’s time. With the help of F12 developer tool bar, you can edit your applied CSS classes and see the result immeditately in the browser.This feature always helps a lot in terms of saves our time.
                 For demo purpose, i have used a simple CSS file and included in the ASPX file.In order to edit/trace the applied CSS classes, you need to follow the below steps:
1) Render you page in IE.
2) Open F12 toolbar. (by press F12 toolbar)
3) Select the “CSS” tab, it will list all the CSS elements used in the page.
4) You can remove the applied style by uncheck the check box. Also, you can create your own rule and apply and view it the browser itself.
Trace CSS using IE Developer Toolbar

Analyze Network Timings:

In some scenario, you may need to want to know about the network timings that took for each requests. These kind of analysis are helpful to do performance related improvements on the browser end. In such case, the "Network" tab in the IE Developer toolbar plays a vital role. You need to follow the below steps to work with network tab:
1) Render you page in IE.
2) Open F12 toolbar. (by press F12 toolbar)
3) Select the “Network” tab.
4) Click “Start debugging” (When you click, the button text will be modified as “Stop debugging”).
5) Then you need reload the page (by pressing F5). This is because whenever the page loads at that time only the files are downloaded from the server.
Network Tab in IE Developer Toolbar


About Other Browsers:
                  Other popular browsers also provide these kind utilities. Chrome offers in the name of "Developer Tools" and Firefox provide as "Inspect Element". These tools also provide the same kind of facilities like IE Developer Toolbar. 
 
I hope you enjoyed this tutorial. For beginners it will give some good idea about the IE Developer toolbar.  Let me know your thoughts as comments. :)
Connect with Us