Banner Ad

Thursday, March 10, 2016

F12 Developer Toolbar in IE– A Good Rescuer

By Francis   Posted at   8:25 PM   IE Developer Toolbar No comments


                             As a web developer, every one will dealt with Internet Explorer. Since our ultimate final output will be render the proper “angle brackets” in browser. In some cases, we may find difficult to debug the rendered HTML. At that time, F12 developer toolbar comes as a rescuer. In this tutorial i have used Internet Explorer Version 10. If you are using the next versions of IE, the look and feel of the toolbar vary slightly, but there is no functional changes that are discussed here. :)

So what is F12 Developer Toolbar:
                           F12 Developer Toolbar is a built-in add-on with Internet Explorer. It will popup from IE when you press F12 Key on your keyboard. Alternatively you can get it by clicking “Tools –> F12 developer tools”. By default, it will be stick with the bottom of IE. In the following section I have mentioned the the uses of F12 Developer toolbar.

F12 Developer Toolbar
Using F12 Developer Toolbar:
There are lot of uses of F12 Developer Toolbar. In this article I am going to highlight few of them. With F12 Toolbar you can:
1) Select DOM Elements
2) Debug Javascript
3) Identify the Javascript errors or missing HTML tag errors on your files.
4) Trace the applied CSS classes.
5) Analyze the Network Timing

Set up the code:
In order to explain the above functionalities I have used the below HTML markup. It’s a simple ASPX file with a textbox and a button. The text box accepts an integer value and validate it and show the alert box accordingly.
<%@ Page Language="C#" AutoEventWireup="true" CodeBehind="Home.aspx.cs" Inherits="SessionDemo.Home" %>
<!DOCTYPE html>
<html xmlns="http://www.w3.org/1999/xhtml">
<head runat="server">
    <title></title>
    <link href="Home.css" rel="stylesheet" />
    <script type="text/javascript">
        function validateAge()
        {
            var age = document.getElementById("txtAge").value;
            if(isNaN(age))
            {
                alert("You have entered valid age");
            }
            else {
                alert("You have entered invalid age");
            }
        }
    </script>
</head>
<body>
    <form id="form1" runat="server">
        <div>
            Enter Age: 
            <input type="text" id="txtAge" />
            <input type="button" id="btnValidate" value="Validate Age" onclick="validateAge();" class="btn"/>
        </div>
    </form>
</body>
</html>

Select DOM Elements:
This is an important feature of Developer Toolbar. You can easily navigate the particular DOM elements by clicking on it on the IE. So that you can easily spot the respective "piece of markup" for that element in the whole page. This facilitate to easily fix the issues related to design.In order to select the DOM element, you need to do the following:
  1. Select the Arrow mark icon (Select Element by click) on the top left in Developer toolbar.
  2. Now you can select any element in the page(Elements are highlighted with the rectangle boxes).
  3. When you select the element, soon the IE Developer toolbar will highlight the particular markup. Refer the below screen shot.

Select DOM Element
Debug JS using F12 Toolbar:
In order to debug the JS, just run the above HTML page in IE and follow the steps:
1) Open F12 Toolbar
2) Go to “Script” tab, where the entire markup listed.
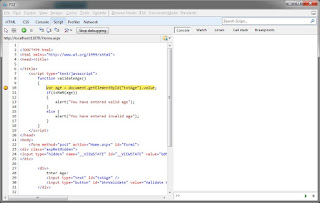
3) Place the breakpoint on the javascript. (Please refer the below screen how to set the breakpoint)
4) Click on the “Start debugging” button.
5) Since the Js function is triggered when you click the button. Just click the button to start the debugging.
Setup the Breakpoint
Debug JS in IE Developer Toolbar

Identify the Javascript errors:
                  In some case as a developer we may do some mistakes typo error. As an example, refer the below code at line no 10, wrongly typed as value() instead of value (which is get the text box value). There is no such method is available in JS. It will be easily identified by IE developer toolbar. The point here is, these type of Javascript related issues easily identified by IE Developer tool bar.

<%@ Page Language="C#" AutoEventWireup="true" CodeBehind="Home.aspx.cs" Inherits="SessionDemo.Home" %>
<!DOCTYPE html>
<html xmlns="http://www.w3.org/1999/xhtml">
<head runat="server">
    <title></title>
    <link href="Home.css" rel="stylesheet" />
    <script type="text/javascript">
        function validateAge()
        {
            var age = document.getElementById("txtAge").value();
            if(isNaN(age))
            {
                alert("You have entered valid age");
            }
            else {
                alert("You have entered invalid age");
            }
        }
    </script>
</head>
<body>
    <form id="form1" runat="server">
        <div>
            Enter Age: 
            <input type="text" id="txtAge" />
            <input type="button" id="btnValidate" value="Validate Age" onclick="validateAge();" class="btn"/>
        </div>
    </form>
</body>
</html>

In order to identify these kind of issues, you should follow the below steps:
1) Render you page in IE.
2) Open F12 toolbar.
3) Select the “Console” tab.
4) Since this JS function is called when you hit the button “Validate Age”. So just click on it.
5) You can see the error messge and when you click on the hyper link detail it will point out the repective line that causes the error.
Identify Javascript Error

Identify missing HTML tag errors:
                                Most of the time we may not closed the end tag of the HTML element. Most of the time it will not cause any issues luckily. In some worst cases, it will collapse all the design of your page. IE Developer tool bar is very much helpful in this case also. It will throw a warning message in the “Console” if your markup missed out anything like missing closing tag.

<%@ Page Language="C#" AutoEventWireup="true" CodeBehind="Home.aspx.cs" Inherits="SessionDemo.Home" %>
<!DOCTYPE html>
<html xmlns="http://www.w3.org/1999/xhtml">
<head runat="server">
    <title></title>
    <link href="Home.css" rel="stylesheet" />
    <script type="text/javascript">
        function validateAge()
        {
            var age = document.getElementById("txtAge").value();
            if(isNaN(age))
            {
                alert("You have entered valid age");
            }
            else {
                alert("You have entered invalid age");
            }
        }
    </script>
</head>
<body>
    <form id="form1" runat="server">
        <div>
            Enter Age: 
            <input type="text" id="txtAge" />
            <span><span>
            <input type="button" id="btnValidate" value="Validate Age" onclick="validateAge();" class="btn"/>
        </div>
    </form>
</body>
</html>

As you see the above code missing a closing tag in the “span” element at the line no 26. When you run the page you can see the warning message in the console like below:
Identify Missing HTML Tags using Developer Toolbar

Trace CSS:
                  In some cases, we may require the to change the applied css, in the page to achieve the exact design as per requirement we have. Normally, as a developer we render the page in browser and comes to the source code and adjust the CSS classes then again go to and run the page in browser to check the changes.
                 In these kind of scenario, F12 developer tool bar plays a vital role to save developer’s time. With the help of F12 developer tool bar, you can edit your applied CSS classes and see the result immeditately in the browser.This feature always helps a lot in terms of saves our time.
                 For demo purpose, i have used a simple CSS file and included in the ASPX file.In order to edit/trace the applied CSS classes, you need to follow the below steps:
1) Render you page in IE.
2) Open F12 toolbar. (by press F12 toolbar)
3) Select the “CSS” tab, it will list all the CSS elements used in the page.
4) You can remove the applied style by uncheck the check box. Also, you can create your own rule and apply and view it the browser itself.
Trace CSS using IE Developer Toolbar

Analyze Network Timings:

In some scenario, you may need to want to know about the network timings that took for each requests. These kind of analysis are helpful to do performance related improvements on the browser end. In such case, the "Network" tab in the IE Developer toolbar plays a vital role. You need to follow the below steps to work with network tab:
1) Render you page in IE.
2) Open F12 toolbar. (by press F12 toolbar)
3) Select the “Network” tab.
4) Click “Start debugging” (When you click, the button text will be modified as “Stop debugging”).
5) Then you need reload the page (by pressing F5). This is because whenever the page loads at that time only the files are downloaded from the server.
Network Tab in IE Developer Toolbar


About Other Browsers:
                  Other popular browsers also provide these kind utilities. Chrome offers in the name of "Developer Tools" and Firefox provide as "Inspect Element". These tools also provide the same kind of facilities like IE Developer Toolbar. 
 
I hope you enjoyed this tutorial. For beginners it will give some good idea about the IE Developer toolbar.  Let me know your thoughts as comments. :)

Sunday, February 7, 2016

Visual Studio Tips and Tricks -13 : Debugging with Visual Studio

By Francis   Posted at   3:15 PM   Visual Studio Tips and Tricks No comments
Visual Studio is a great IDE for developing all type of Microsoft desktop/web stack applications. There is no doubt on that!. One of the main feature provided in Visual Studio is it’s capability provide more options to debugging the applications. In this post I explained some basic concepts about debugging in Visual Studio.


You can also check my other Visual Studio Tips here.

Setup the environment:

In this post I’m using Visual Studio 2015 Community edition. Based on your version of Visual studio some options may differ. For simple and neat explanation, here I’m going to use a simple for loop C# code snippet.

So What is breakpoint?
When you run the program in Visual Studio IDE, if you want to check the execution of a particular routine or function at that time you can set the breakpoint. Probably, it set before to run the application. So when the program executes, the breakpoint hits and the program waits there. So that you can step into the program and take a deep look into the code and check the values there itself. This is the main advantage of breakpoints.

Set normal Breakpoint:
Set the breakpoint in an application is very simple. You can hit the F9 key or you can click on the left most border in Visual Studio. It will keep the break point on the particular line.
After setting the break point, Visual Studio indicate the particular line with the Red color and preceded with a dot like below.

Breakpoint-in-VisualStudio

In these kind of break points, it will hit without any conditions. So whenever, the execution cross the line it will simply hit there.

Set Conditional Breakpoint:
So as we discussed in the previous section,say for example, if we set the break point with in a loop it will hit the break point without any condition. So the break point is hit often. Instead of this, we may want to set some conditions. Let’s see how we can do it.

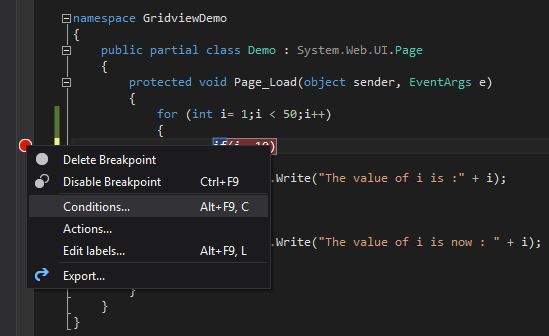
1. Right click on the break point and select “Conditions…” in the context menu.
Conditional-Breakpoint-Menu
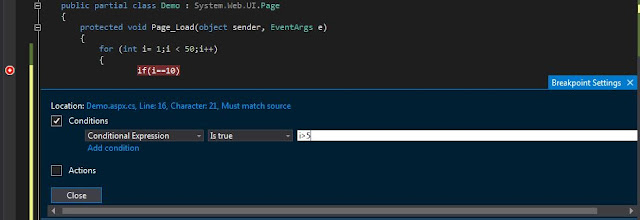
2. Visual Studio 2015 offers the below “Breakpoint Settings” window to set up the condition.
Conditional-Breakpoint-Window
3. Here I’m going to set the “Conditions” as : When the counter value(i) is greater than 5 at that time it will hit the break point. That means, till the value of the counter value is 5, it will not hit. After that it will hit.
Setting-Conditions
Set-Conditions
In some cases you may want to track based on some process id or thread id etc. Visual studio also give options for this.

Breakpoint-Window-Filter
In some cases, we want to count the “Hit count”,meant whenever the break point hits it will consider as a hitcount. You can specify it by selecting “Hit Count” list item as below:
Breakpoint-Window-HitCount

Set Actions:
“Breakpoint Settings” window also offers that log message to Output window. At that you can make use of “Actions”. There are some special keywords are there, which have a special meaning when you use in the “Action” text box.

Breakpoint-Window-Action-SpecialKeyword
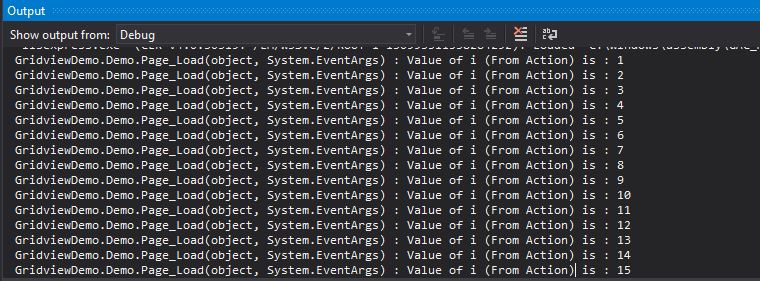
When you specify Action alone, there is a checkbox named “Continue execution”, if you check this the breakpoint will not hit. You can see the message in the “Output Window”.
Breakpoint-Window-Specify-Action
Breakpoint-Window-Result-in-OutputWindow
  In the above action, we specify the special keyword "$Function", which prints the current function name as you see in the above screen shot.

Disable Break points:
In some cases, you may want to continue the execution of your program without hitting the breakpoints and later cases you may need them. At that time you can use the "Disable Breakpoint" option by using the short cut key "Ctrl + F9" key. Later cases, you can use the same short cut key to "Enable Breakpoint". You can make use of these options during run time also.

Disabled-Breakpoint
Disabled-Breakpoint
Readers, hopefully this tutorial helps you to understand about the various debugging options provided by Visual Studio. Let me know your thoughts as comments. Happy programming!


Wednesday, January 6, 2016

Replace Special character from string using Regular expression in C#

By Francis   Posted at   6:04 PM   CodeSnippets No comments
In one of the forum post, the poster asked to
  1. Remove all the special character
  2. Then Remove the space and replace with _ (underscore) character
Say for example, if he gave, the input string as “Levi Jeans (Blue) & yellow 101 – 150Ah” and the output he wants as “Levi_Jeans_Blue_yellow_101_150ah”.
Solution:

            string yourInput = "Levi Jeans (Blue) & yellow 101 - 150Ah"; 
            Regex rgx = new Regex(@"[^a-zA-Z\d\s]"); 
            // Replace Special Charater and space with emptystring 
            string finalOutput = rgx.Replace(yourInput,""); 
            Console.WriteLine(finalOutput); 
            Regex rgx1 = new Regex("\\s+"); 
            // Replace space with underscore 
            finalOutput = rgx1.Replace(finalOutput, "_");

Monday, January 4, 2016

Open Live Writer–An alternative for Windows Live writer

By Francis   Posted at   4:55 PM   Open Live Editor No comments
                          Open Live Writer

                     For the last couple of year, i have used a windows essential tool called “Windows Live Writer” for blogging. Yes! It’s made my job easier. It reduces huge amount of work regarding formatting, insert images etc., in my blog post. Literally, I’m a big fan of it.
                        But most recently, Google changed it’s authentication mode and adopt a new authentication technique. So whenever you tried to post/publish a draft you will get the below error:
WindowsLiveEditor_Issue
                         As a remedy, I Googled and Binged a lot and find an another alternative called “Open Live Writer”. You can download it from here. It’s a opensource editor, developed by a group of people inside and outside (.NetFoundation) Microsoft. If you want to participate you can get the source from: https://github.com/OpenLiveWriter/OpenLiveWriter. If you want to know about more Scott Hanselman’s post is very much helpful, which discusses removed features and features on the way in OLW etc.,

                          One of the main draw back that I found in OLW(Open Live Editor) is, it missed out the “Automatic spell check”, which I thought all bloggers love that. Another good news is you can run OLW and Windows Live Editor side by side.As a tweak for the “Spell Check Issue”, I’m still uses Windows Live Editor to draft my blog and publish it by OLW. Hope this tweak is still worth mentioning! wlEmoticon-smile[2]

Hope this post will help for someone! Smile

December Month Winner in C# Corner

By Francis   Posted at   11:37 AM   CSharpCorner No comments
                       DecemberMonthWinner


                                 I’m very much happy to announce that, I’m also one of the monthly winner in C#Corner for the month December 2015. This month award is something special to me since third time in a row, I received this award. I’m very much happy and thankful to all of my readers,friends and colleague who are all always improves me a lot!
Connect with Us